 Verbatime
JMC plugin#
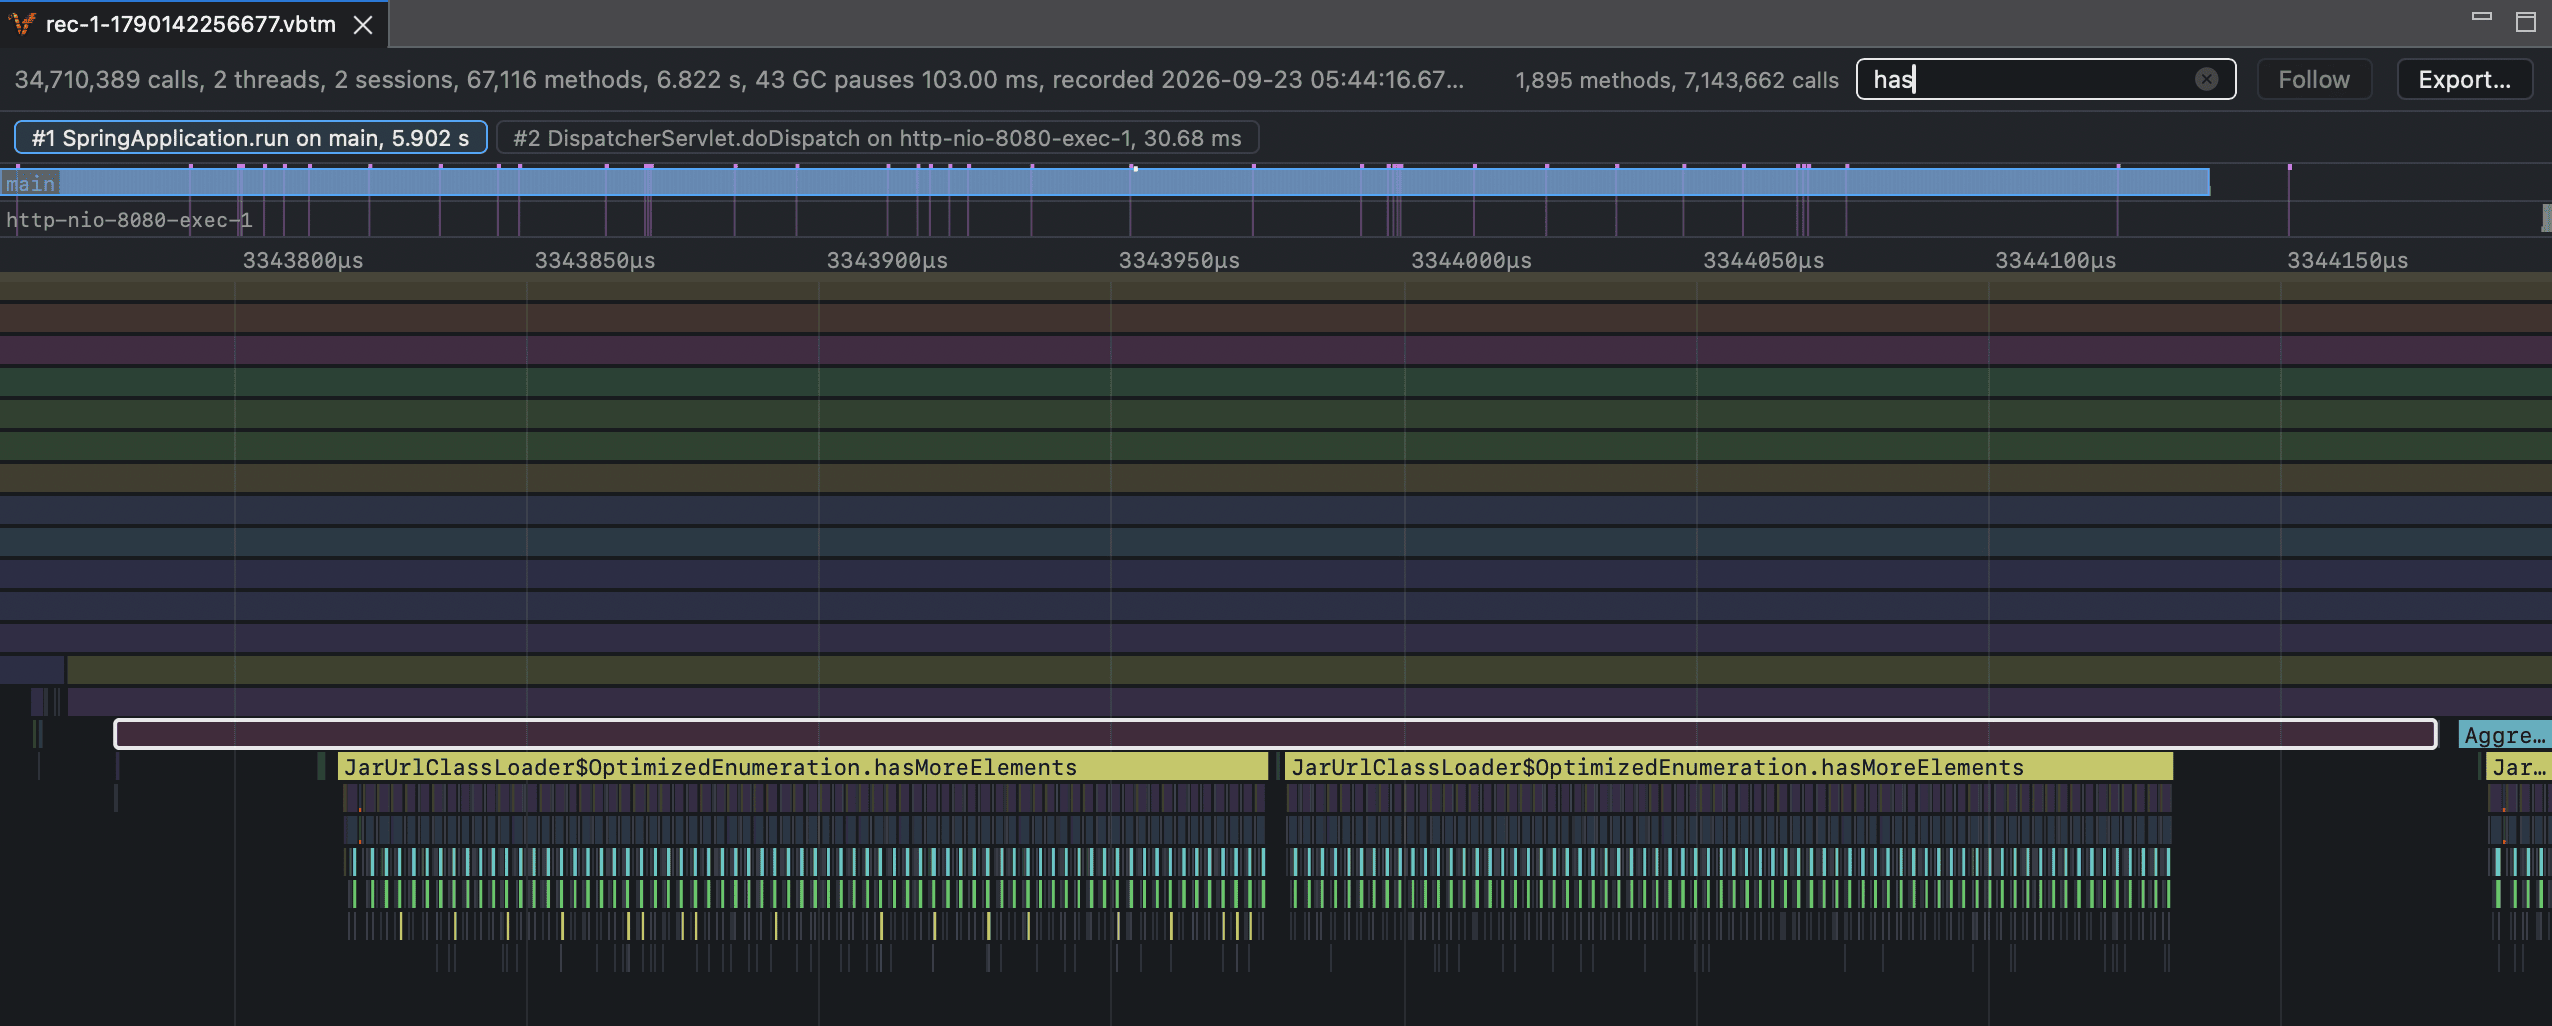
The JDK Mission Control plugin starts and stops recordings, and shows them as a timeline flame chart.
Install#
Download verbatime-jmc-plugin.jar from the
GitHub releases page, copy it into the dropins
directory of JDK Mission Control, and restart it.
cp verbatime-jmc-plugin.jar "/Applications/JDK Mission Control.app/Contents/Eclipse/dropins/"
cp verbatime-jmc-plugin.jar <jmc>/dropins/
To uninstall, delete the file and restart.
Record#
Start the application with the agent and the JMX flags. Then choose
Window > Verbatime, and in the Verbatime Control view:
- Enter
localhost:7091and press Connect. - Under Instrumentation roots, type part of a method name and pick a match, or type
pkg.Class::method. A green dot means the root is instrumented. A yellow dot means its class has not loaded yet. - Press Start recording, use the application, then press Stop recording.
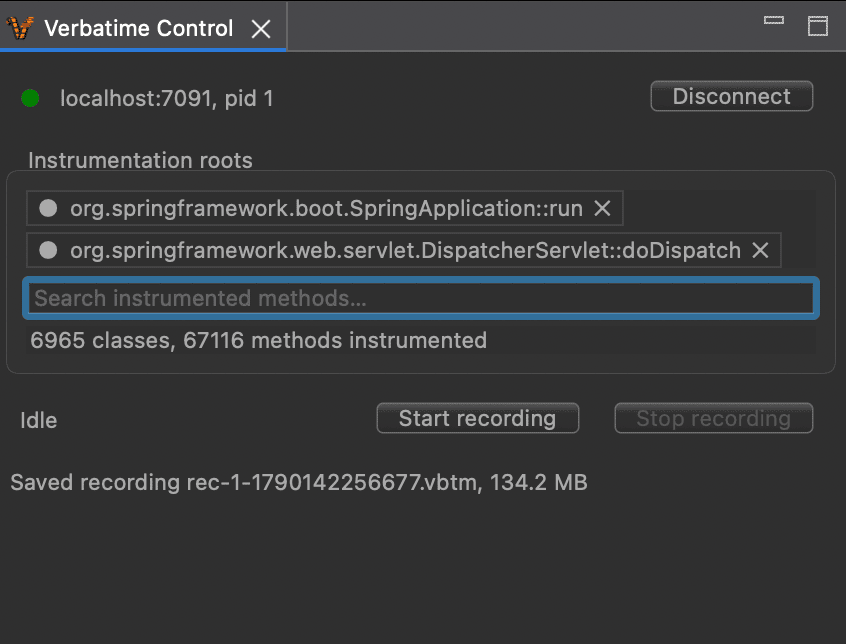
The recording is saved on your machine and opens right away. Roots cannot be changed while recording.
View#
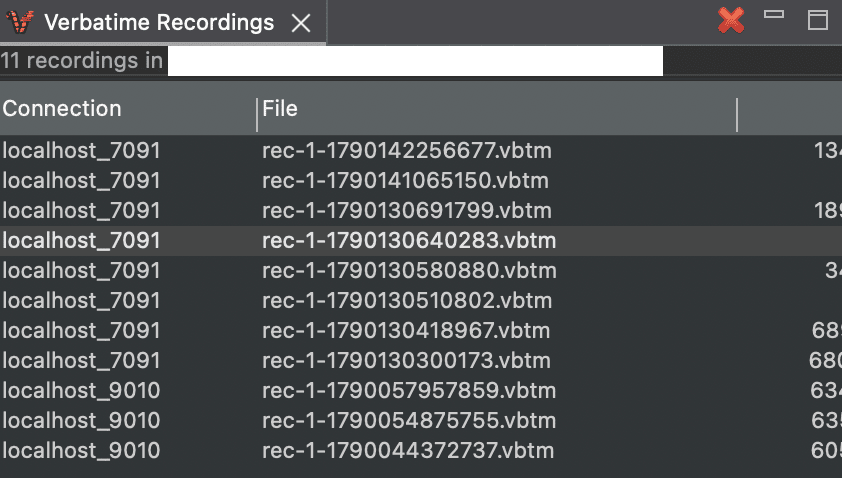
Open a recording from the Verbatime Recordings view, or with File > Open. Select a session to
show its flame chart, then click a call.
| View | Shows |
|---|---|
| Verbatime Control | Connects to an application, sets the roots, and starts and stops recording. |
| Verbatime Recordings | The recordings saved on your machine. |
| Verbatime Call Details | The selected call and its callers, root first. |
| Verbatime Top-down | The call tree under the selected call, heaviest child first. |
| Verbatime Bottom-up | Who called each method under the selected call. |
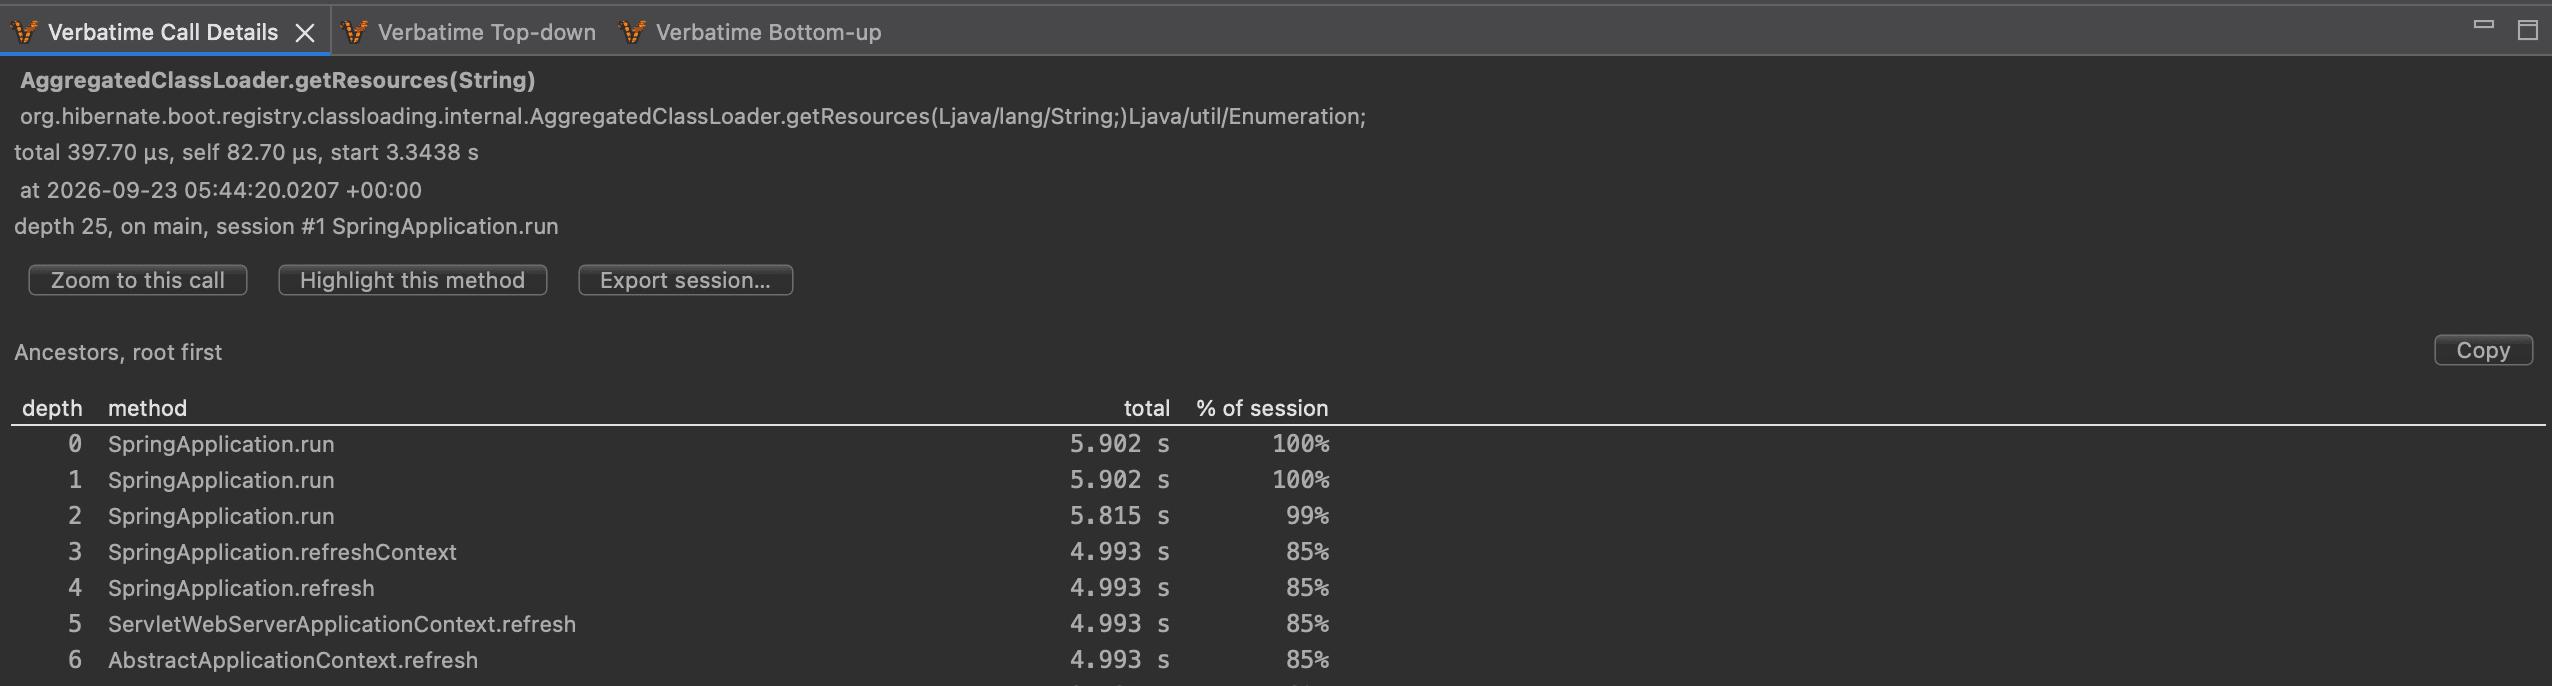
To find a method, type part of its name in Search methods (⌘F on macOS). Calls that match stay
in color, and the rest are dimmed.
Settings#
Under Window > Preferences > Mission Control > Verbatime, you can change the directory where
recordings are saved.